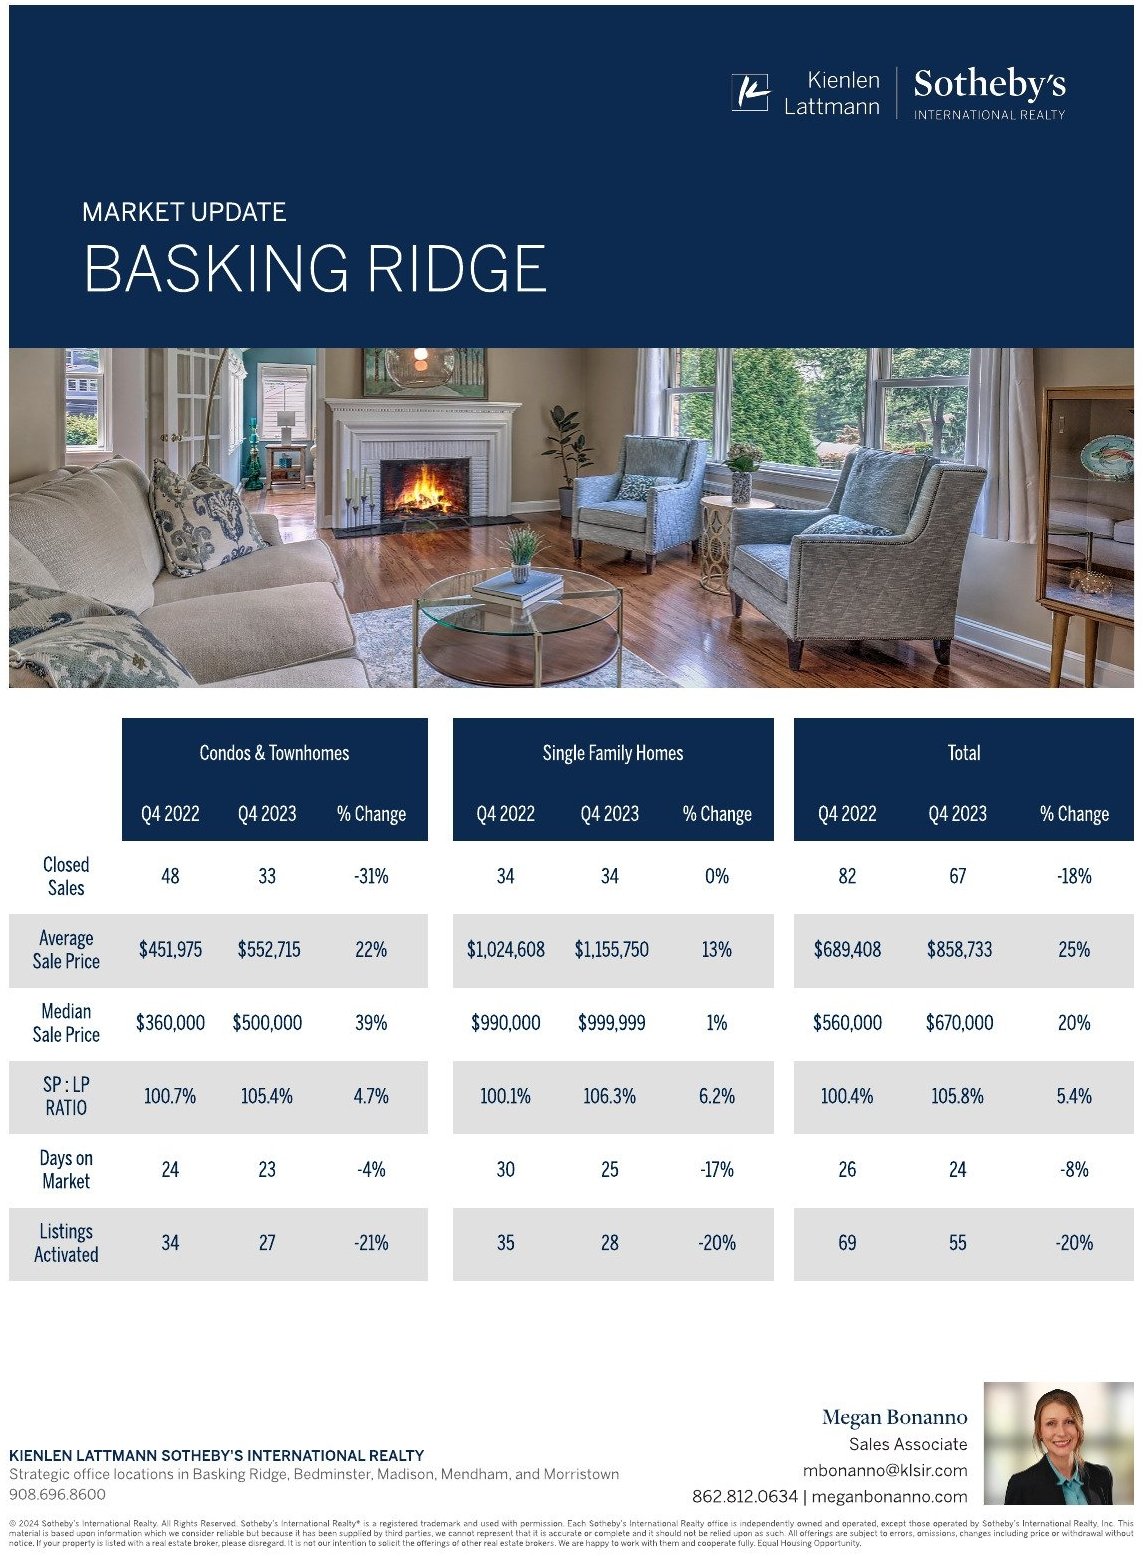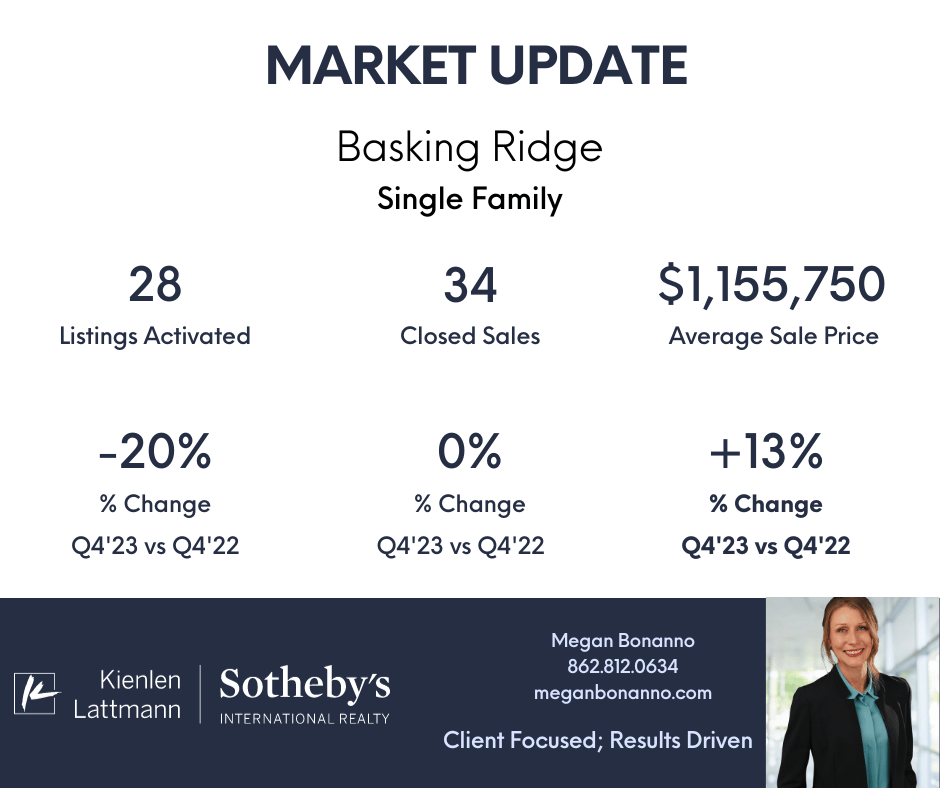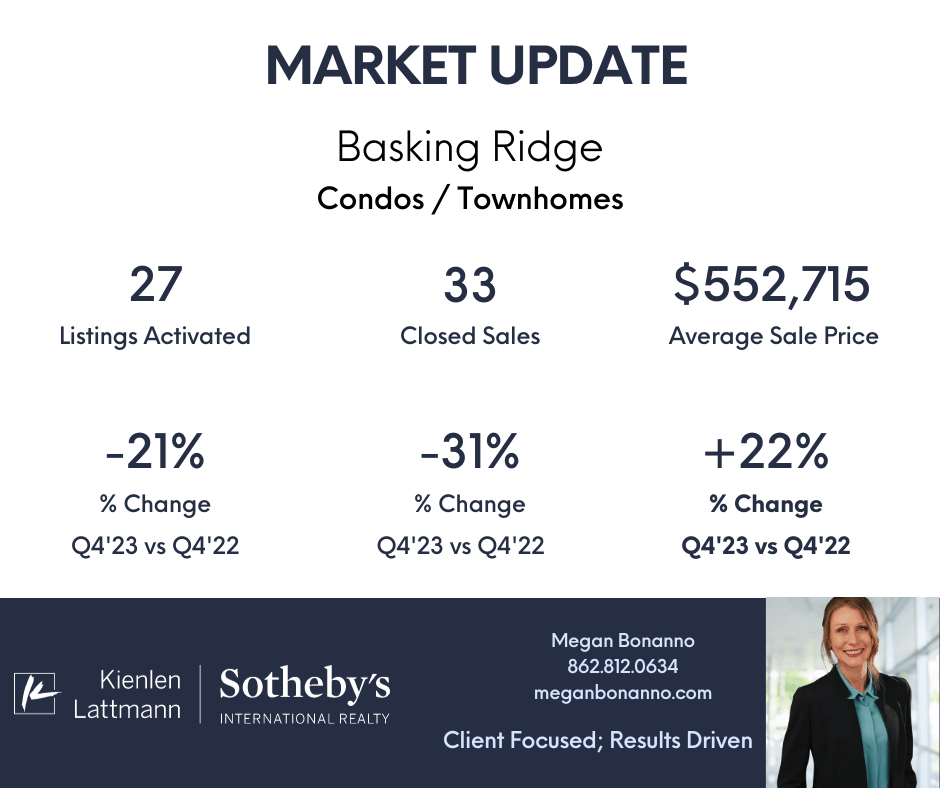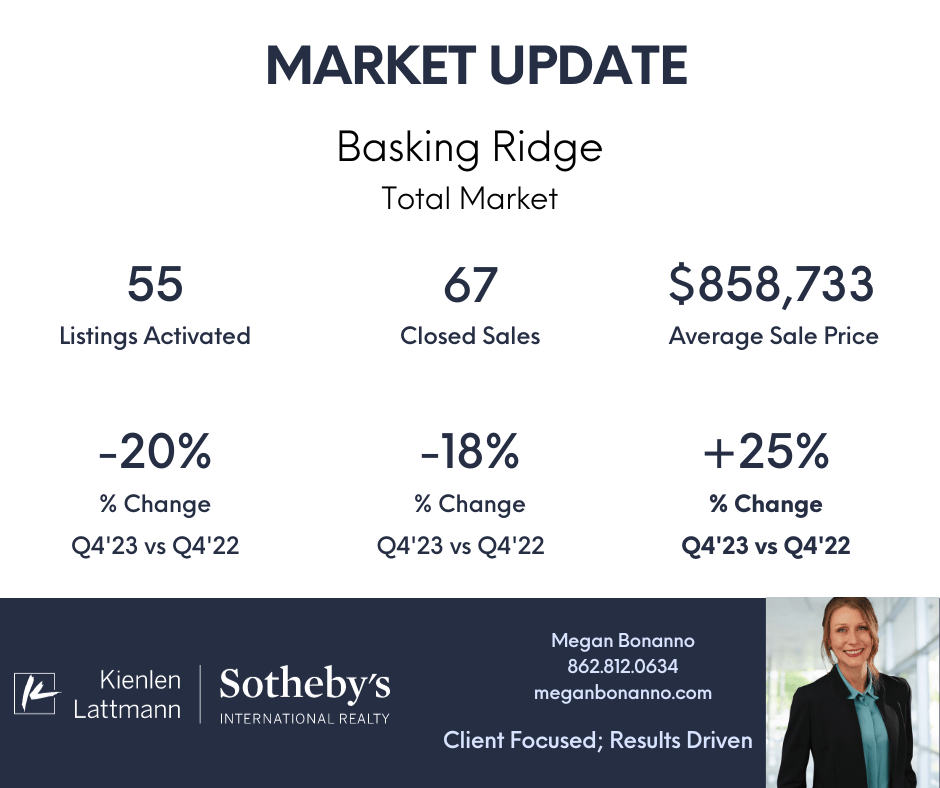
Inventory Trends
A 20% decline of available inventory in Q4' 23 vs.Q4 '22. This trend, coupled with the ever continuing buyer demand, are fueling the price appreciation gains within our community.
Closed Sales Trends
Sales velocity is down in Q4'23, however it's commensurate with the lower inventory levels. This impact is more pronounced in the townhome segment where sales are down by 31% in Q4'23 vs. Q4'22.
Sale Price Trends
A noteworthy increase of 25% in the average selling price in Q4'23 vs.Q4'22.