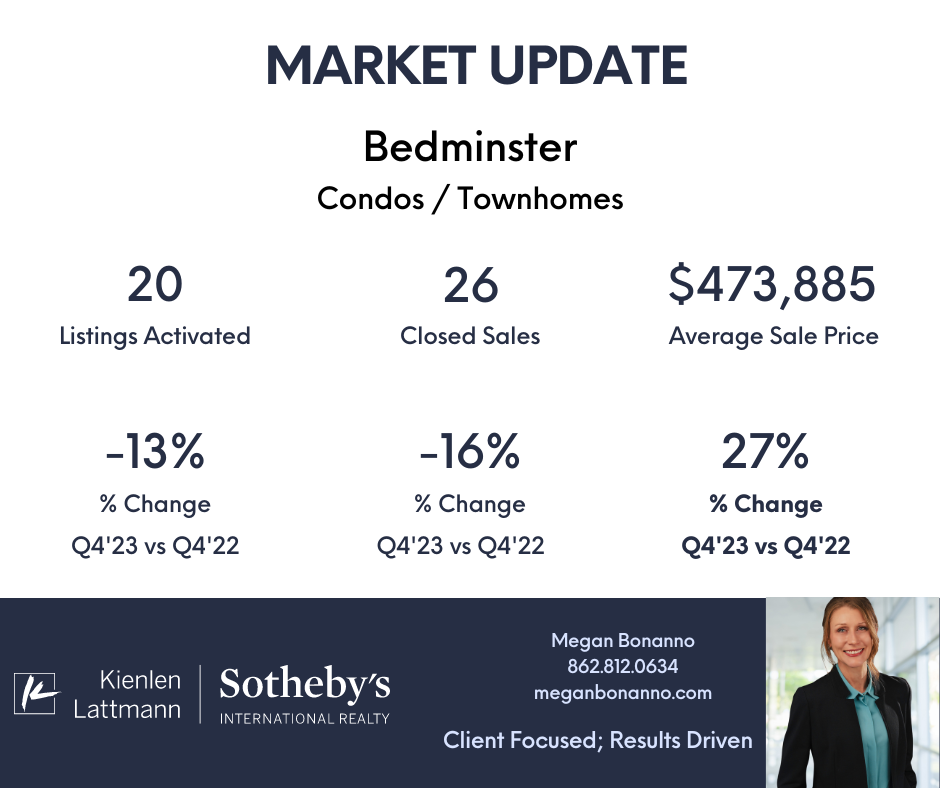
Bedminster Market Insights - A comparison of Q4’23 vs. Q4'22
Bedminster Inventory Trends
In the final quarter of 2023, we observed a significant reduction in available inventory, with a decline of 15% to 20% compared to the same quarter in 2022. This trend, coupled with the ever-continuing buyer demand, are fueling the price appreciation gains within our communities.
Bedminster Closed Sales Trends
Sales velocity is down in Q4'23 by 26%. This decline is particularly evident in the single-family home sector, which experienced a dramatic 63% decline in closed sales.
Bedminster Sale Price Trends
Our area continues to see an upward trend in property values. It is essential to highlight that the remarkable 172% increase in the average sale price of single-family homes in Bedminster is largely due to the different mix of homes sold in Q4 ’23 compared to Q4 ’22. For instance, out of the three single family homes sold in Q4 ’23, two closed at over $2 million, with one reaching $2.8 million. This is in stark contrast to 2022, where eight homes sold for under a million, and the highest sale price was $1,180,000.